Overview
The dashboard section gives you an overview of all your partnerships’ overall activities and traction, giving you a single point to track the health of all your partnerships and campaigns at a glance. The dashboard consists of the following sections:Sections
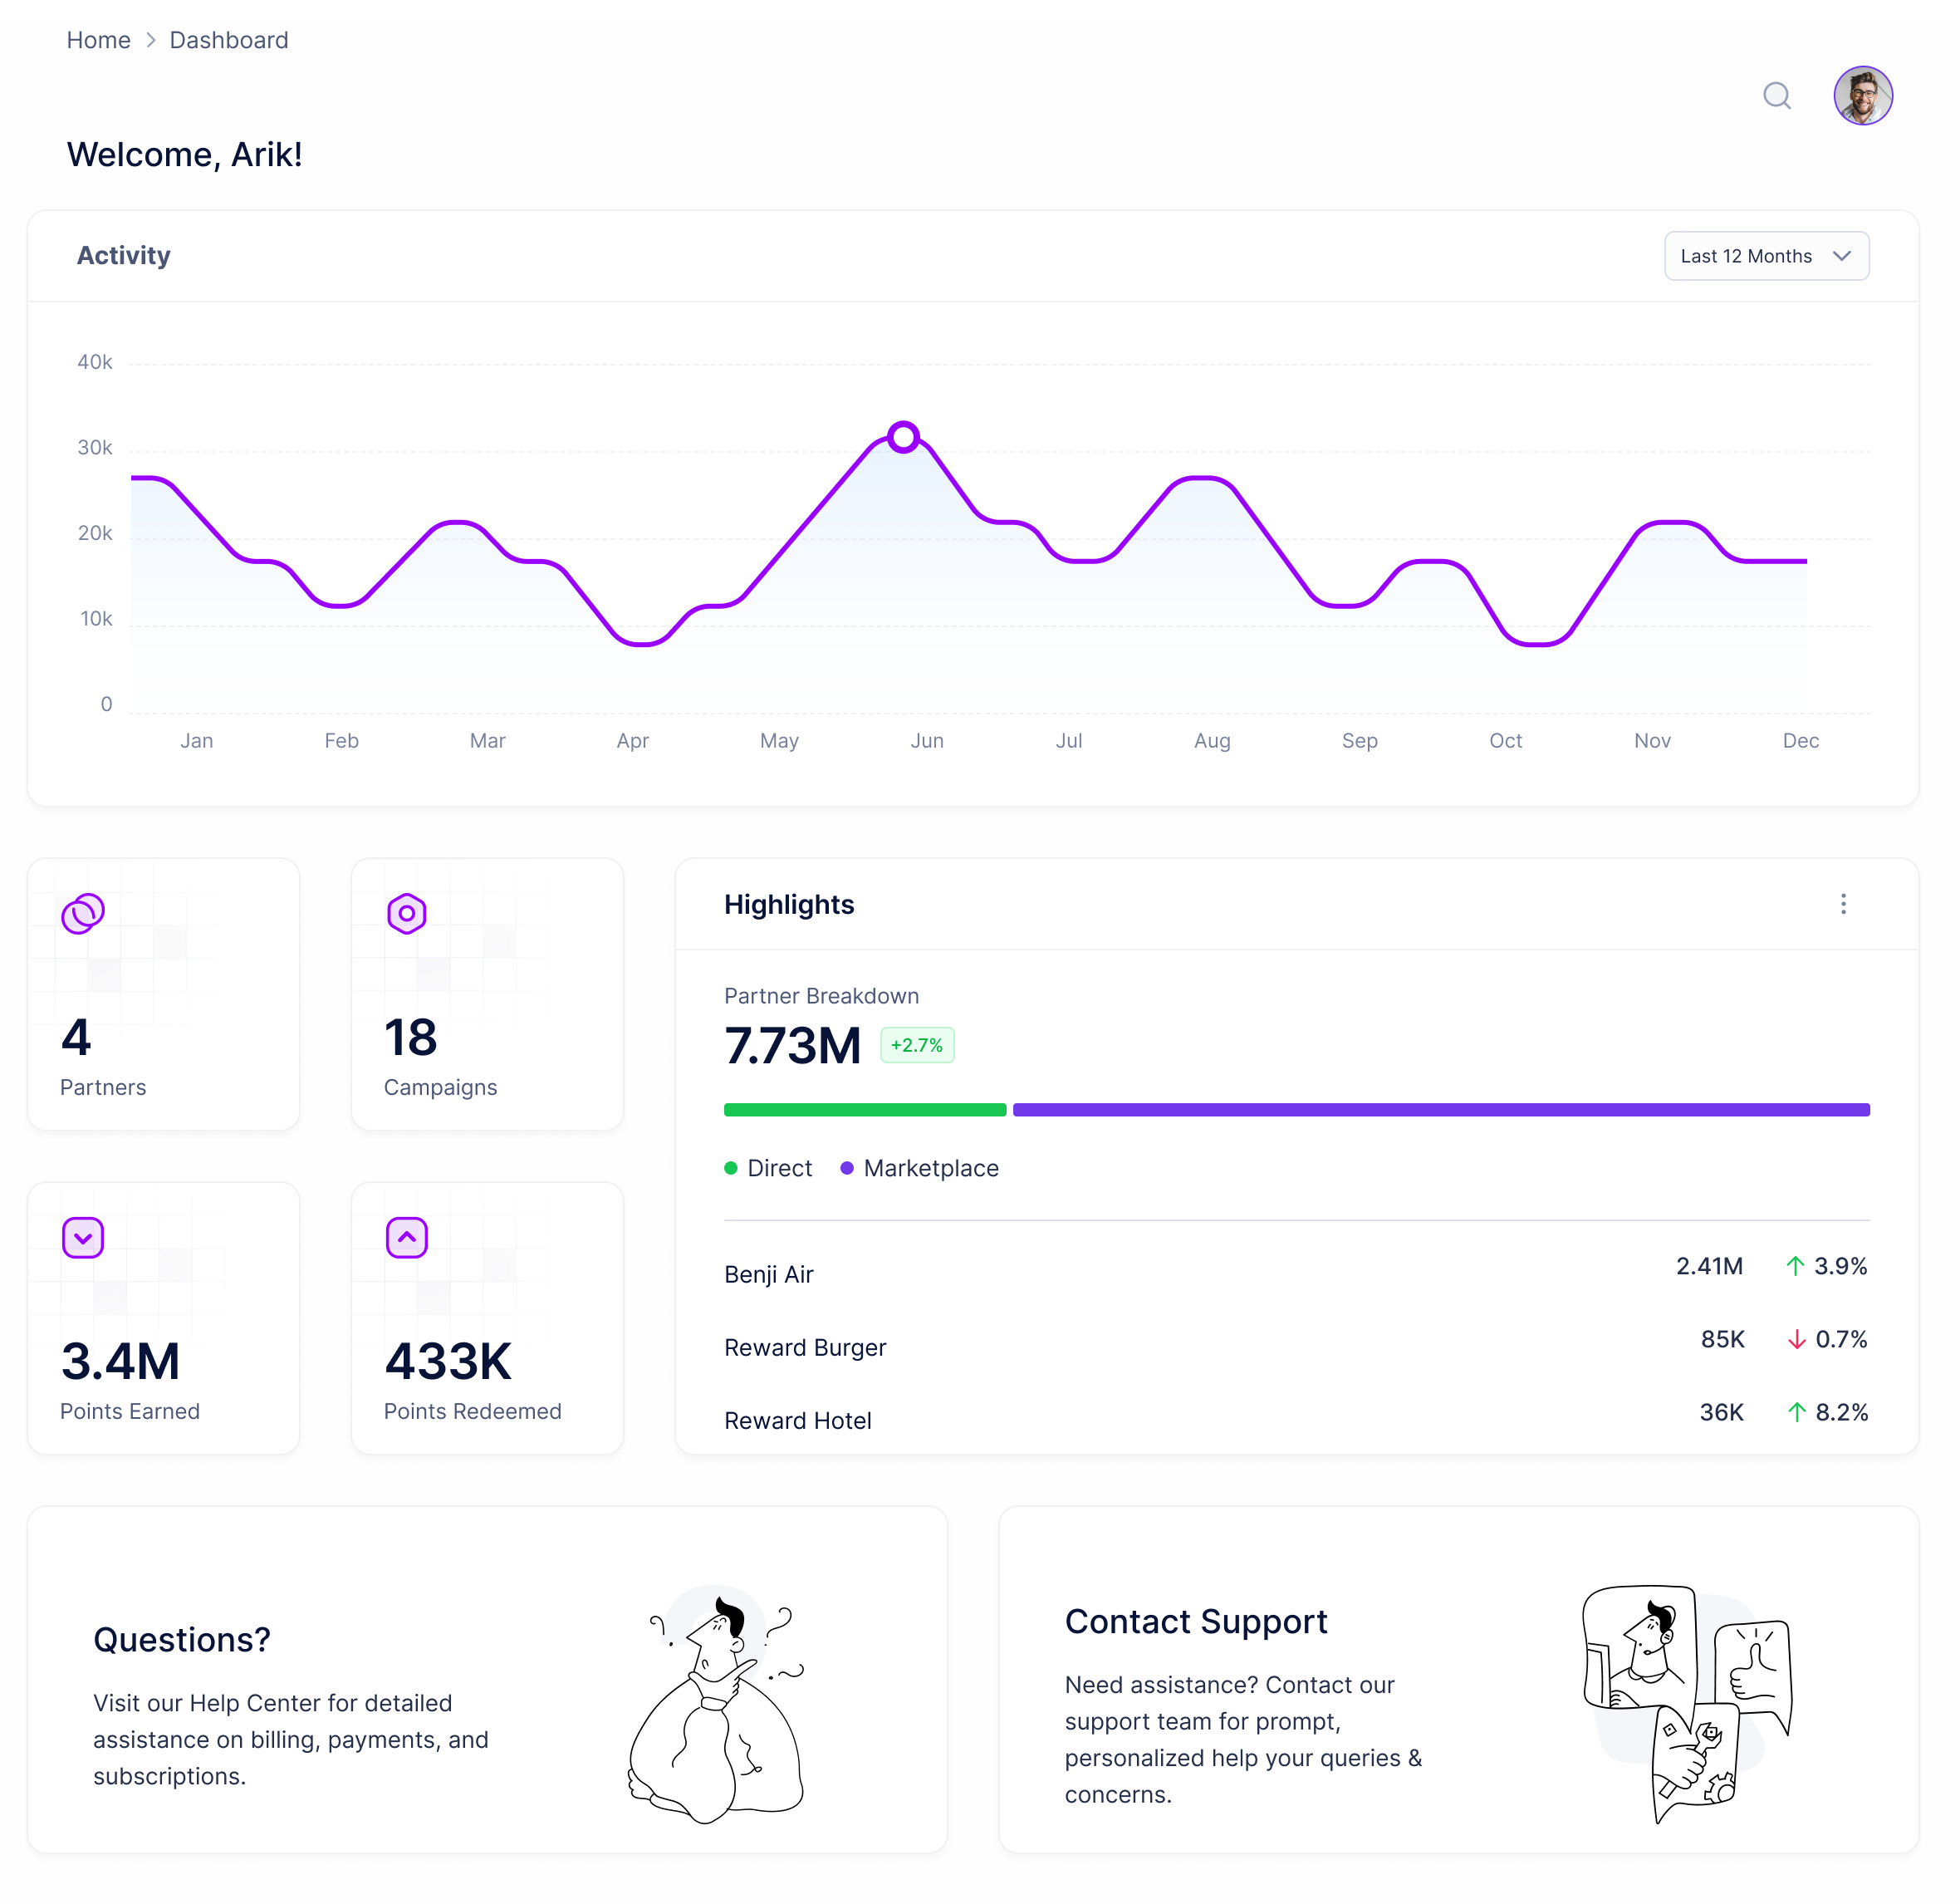
Activity Chart
This section consists of a single chart, that is date range customizable, to see the overall activities across all your campaigns. The line indicators indicate an action triggered by the different campaigns (e.g. Earn or Redeem rewards) and allow you to see aggregated campaign traction over a period of time.Partnerships Breakdown
This section provides you data on your currently running partnerships and campaigns, and consists of the following data points:- Number of active and scheduled partners
- Number of active and scheduled campaigns
- Total amount of points earned through the Benji Platform across all your active, scheduled and completed campaigns
- Total amount of points redeemed through the Benji Platform across all your active, scheduled and completed campaigns
Note that only active, scheduled, or completed partnerships will be aggregated here. Draft campaigns will not be displayed until they are confirmed.
Highlights
This section provides you with highlights across your top running partnerships and campaigns:- Breakdown of activity between Direct and Marketplace partnerships
- Your top 3 performing campaigns and their overall activity, with an indicator of change in traction during the last week (e.g. increase/decrease in traffic percentage)
Support
This section provides you with quick links to get help and contact Benji Support:- Quick link to the Benji Help Center to answer any common questions
- Quick link to contact Benji Support on a chat interface